

Login to DRIPCalc PRO to access member-only content and reports in our Stock Research and Stock Comparison tools.
Not a member yet?
If you are not a member yet, consider signing up for DRIPCalc PRO.
DRIPCalc PRO, designed by and for Dividend Investors, surpasses conventional tools by offering unique insights through our innovative “combo reports.” These reports allow you to visualize critical metrics such as dividend yield and growth rate side by side, enabling comprehensive stock comparisons at a glance.
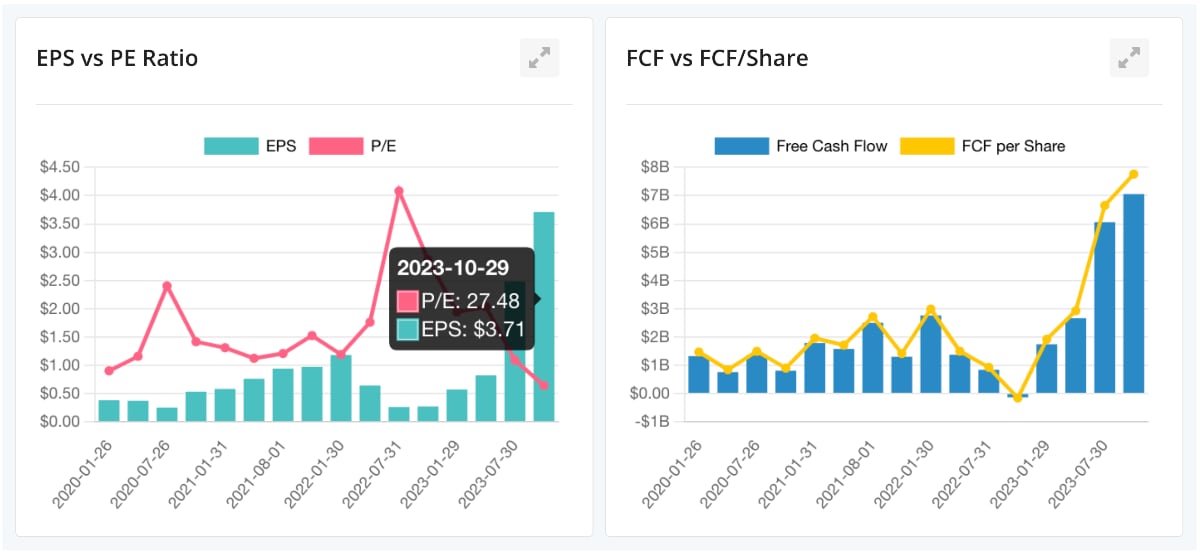
We are most proud of our “combo reports” where you can see 2 metrics together in the same graph. For example:
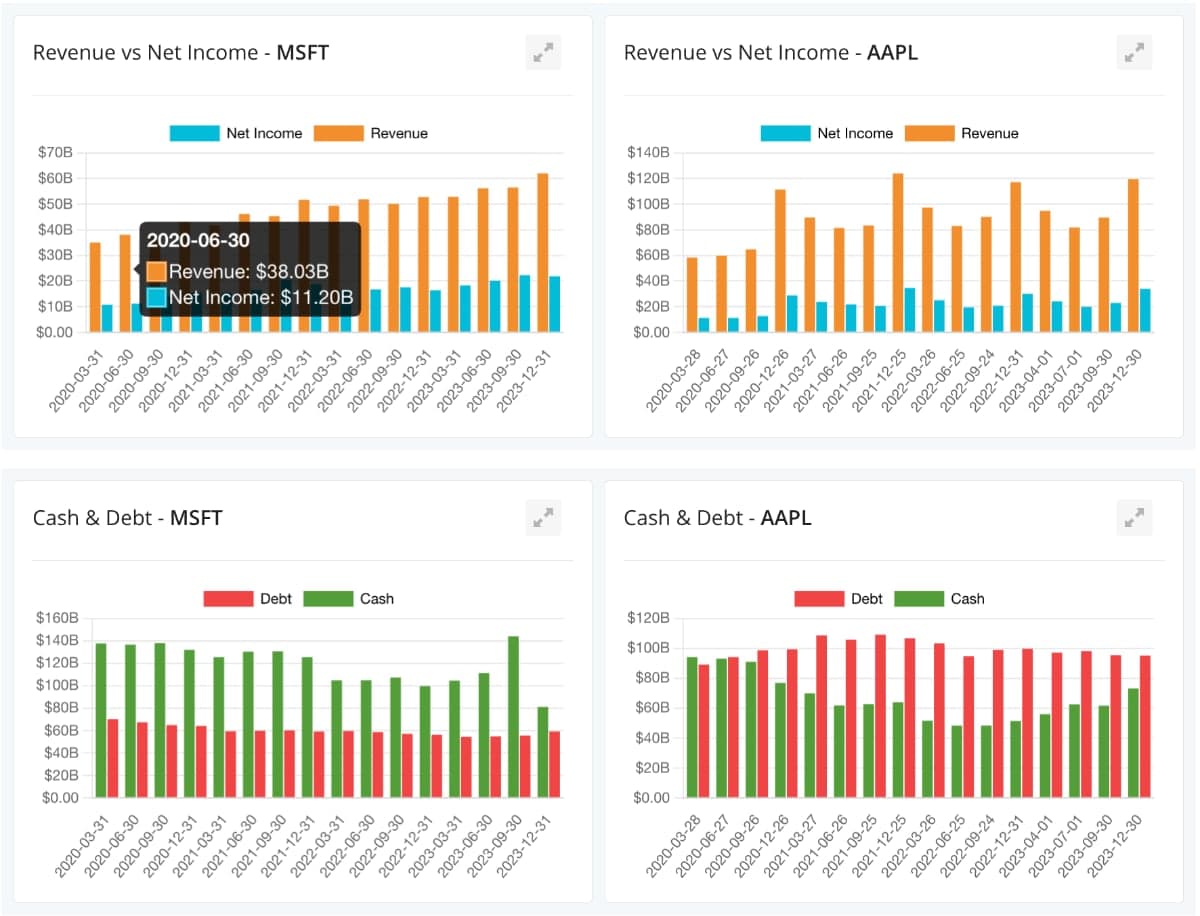
Our compare tool allows you to pick the winner without switching between multiple tabs and forgetting that “number from the other stock”!
Save 25% with annual plan (3 Months Free)
Save 25% with annual plan (3 Months Free)
Pro
$19/mo
$14.25/mo
7-day free trial
- Unlimited Portfolio Tracker
- Portfolio - Lots/Sales/Dividends
- Portfolio Auto-DRIP
- Stock Fundamentals
- DCF valuation modeling
- Compare Stocks Side-by-Side
- Revenue & EPS Estimates
You save $4.75 (25%)
Most Popular
Premium
$32/mo
$24/mo
7-day free trial
- Everything in Pro
- YieldMax PNL Tracker
- YieldMax NAV Erosion Alerts
- Stocks Dashboard
You save $8 (25%)
Ultra
$64/mo
$48/mo
7-day free trial
- Everything in Premium
- Group & weekly ETF estimates
- YouTuber Mode
- Trades summary + CSV export
- Priority data & support
You save $16 (25%)
Pro
$171 ($14.25/mo)
$128.25/yr ($10.69/mo)
7-day free trial
- Unlimited Portfolio Tracker
- Portfolio - Lots/Sales/Dividends
- Portfolio Auto-DRIP
- Stock Fundamentals
- DCF valuation modeling
- Compare Stocks Side-by-Side
- Revenue & EPS Estimates
You save $99.75 (44%)
Most Popular
Premium
$288 ($24/mo)
$216/yr ($18/mo)
7-day free trial
- Everything in Pro
- YieldMax PNL Tracker
- YieldMax NAV Erosion Alerts
- Stocks Dashboard
You save $168 (44%)
Ultra
$576 ($48/mo)
$432/yr ($36/mo)
7-day free trial
- Everything in Premium
- Group & weekly ETF estimates
- YouTuber Mode
- Trades summary + CSV export
- Priority data & support
You save $336 (44%)

