
Research Your Favorite Stock:
Get Comprehensive Stock Metrics for Your Favorite Company
Below is a DEMO of a complete report you will get with our DRIPCalc PRO stock research platform. You can search for your favorite stock in the field above, or skip the fluff, and go straight to the fully functional demo.
A key feature we wanted for our own Dividend Stocks research - having Dividend Payments & Dividend Yield in the same chart. We could not find it anywhere, so we built our own - that's how it all began!
Get Full Access to All Reports with DRIPCalc PRO
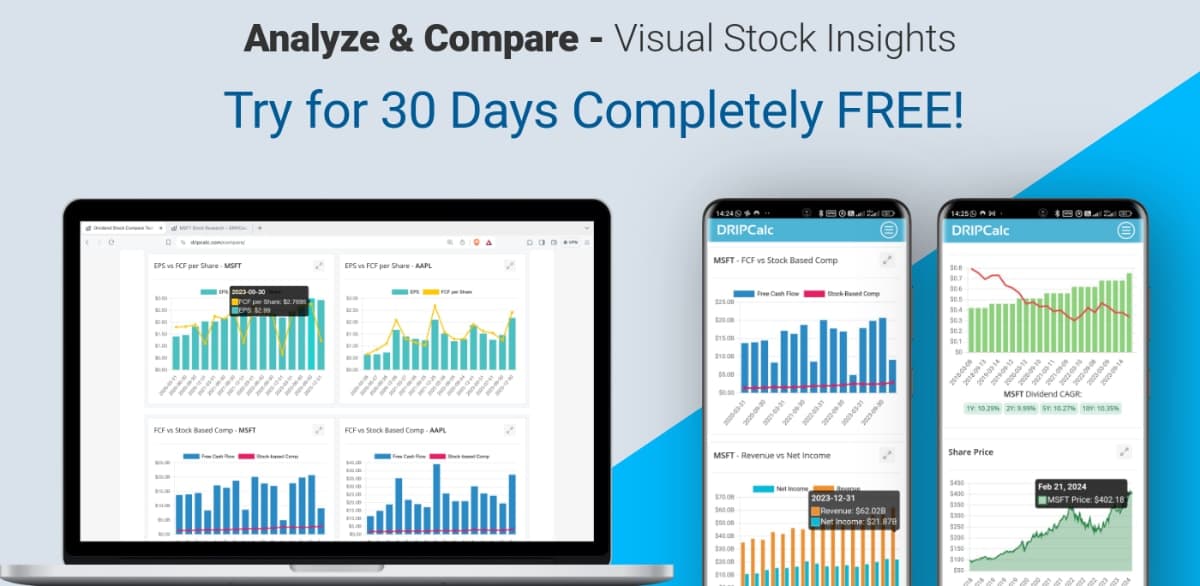
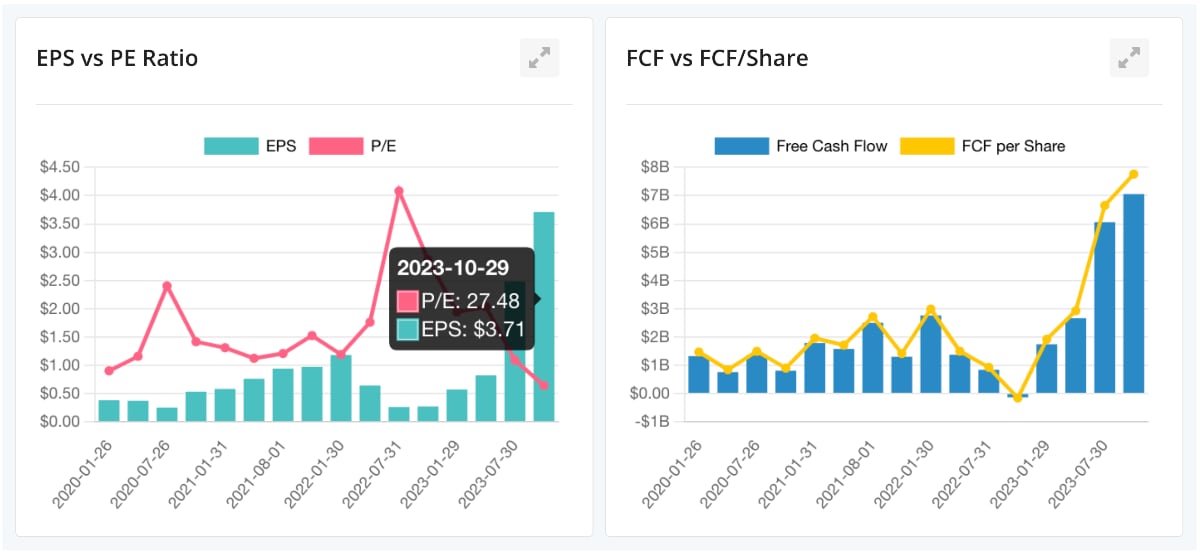
We also are most proud of our "combo reports" where you can see 2 metrics toghether in the same graph. For example:
- Dividend Payments + Yield
- EPS + PE Ratio
- Free Cash Flow + FCF per Share
- Net Income + Revenue
- Company Cash + Long Term Debt
Since we are a Dividends-Oriented stock research site, we also have:
- Dividend Payout Ratio graph, a Dividend/Net Income ratio which shows if company can afford to pay the dividend from its net profits.
- Dividend to FCF Ratio graph, which shows how much money company has to pay dividends, AFTER all the expenses.
Let's not waste any more time - search your favorite stock, or check out COMPLETE EARNINGS profile for NVDA.

NVIDIA Corporation NVDA | NASDAQ
Next Earnings: Mar 16, 2026
Company Overview:
10 Year NVDA Performance Metrics:
NVDA Dividend Payments, Yield & Share Price charts

Unlock All Reports & Research Dividend Stocks like a BOSS!
Get 3 months FREE!
NVDA Dividend Safety: Payout & Dividend to Free Cash Flow Ratios.
NVDA Earnings, Revenue, Cash & Debt, Shares Outstaning:
Revenue, EPS, Net Income & Ebitda - Estimates VS Actual:
Ratios, Profit Margins & Return on Capital:
NVDA Dividends Info:
NVDA Dividend History: Dates, Payments & Yield list
Below is a schedule of all NVDA dividend payments, ex-dates, share price on the day of the payment as well as TTM & forward yield
| Ex-Date | Payment Date | Amount | TTM Yield | Forward Yield | Price on Ex-Date |
|---|---|---|---|---|---|
| 03/11/2026 | 04/01/2026 | $0.010 | 0.02% | 0% | $0.00 |
| 12/04/2025 | 12/26/2025 | $0.010 | 0.02% | 0.02% | $190.53 |
| 09/11/2025 | 10/02/2025 | $0.010 | 0.02% | 0.02% | $188.89 |
| 06/11/2025 | 07/03/2025 | $0.010 | 0.03% | 0.03% | $159.34 |
| 03/12/2025 | 04/02/2025 | $0.010 | 0.03% | 0.04% | $110.42 |
| 12/05/2024 | 12/27/2024 | $0.010 | 0.02% | 0.03% | $137.01 |
| 09/12/2024 | 10/03/2024 | $0.010 | 0.02% | 0.03% | $122.85 |
| 06/11/2024 | 06/28/2024 | $0.010 | 0.02% | 0.03% | $123.54 |
| 03/05/2024 | 03/27/2024 | $0.004 | 0.02% | 0.02% | $90.25 |
| 12/05/2023 | 12/28/2023 | $0.004 | 0.03% | 0.03% | $49.52 |
| 09/06/2023 | 09/28/2023 | $0.004 | 0.03% | 0.04% | $43.09 |
| 06/07/2023 | 06/30/2023 | $0.004 | 0.04% | 0.04% | $42.30 |
| 03/07/2023 | 03/29/2023 | $0.004 | 0.07% | 0.06% | $26.98 |
| 11/30/2022 | 12/22/2022 | $0.004 | 0.09% | 0.1% | $15.34 |
| 09/07/2022 | 09/29/2022 | $0.004 | 0.12% | 0.13% | $12.22 |
| 06/08/2022 | 07/01/2022 | $0.004 | 0.09% | 0.11% | $14.52 |
| 03/02/2022 | 03/24/2022 | $0.004 | 0.07% | 0.06% | $28.15 |
| 12/01/2021 | 12/23/2021 | $0.004 | 0.05% | 0.05% | $29.64 |
| 08/31/2021 | 09/23/2021 | $0.004 | 0.07% | 0.07% | $22.48 |
| 06/09/2021 | 07/01/2021 | $0.004 | 0.09% | 0.08% | $20.21 |
| 03/09/2021 | 03/31/2021 | $0.004 | 0.13% | 0.12% | $13.35 |
| 12/03/2020 | 12/29/2020 | $0.004 | 0.12% | 0.12% | $12.94 |
| 09/01/2020 | 09/24/2020 | $0.004 | 0.12% | 0.13% | $12.35 |
| 06/04/2020 | 06/26/2020 | $0.004 | 0.18% | 0.17% | $9.15 |
| 02/27/2020 | 03/20/2020 | $0.004 | 0.25% | 0.31% | $5.14 |
| 11/27/2019 | 12/20/2019 | $0.004 | 0.29% | 0.27% | $5.98 |
| 08/28/2019 | 09/20/2019 | $0.004 | 0.4% | 0.37% | $4.32 |
| 05/30/2019 | 06/21/2019 | $0.004 | 0.45% | 0.42% | $3.79 |
| 02/28/2019 | 03/22/2019 | $0.004 | 0.4% | 0.36% | $4.44 |
| 11/29/2018 | 12/21/2018 | $0.004 | 0.39% | 0.49% | $3.24 |
| 08/29/2018 | 09/21/2018 | $0.004 | 0.22% | 0.23% | $6.59 |
| 05/23/2018 | 06/15/2018 | $0.004 | 0.24% | 0.23% | $6.63 |
| 02/22/2018 | 03/16/2018 | $0.004 | 0.24% | 0.24% | $6.26 |
| 11/22/2017 | 12/15/2017 | $0.004 | 0.27% | 0.31% | $4.79 |
| 08/22/2017 | 09/18/2017 | $0.004 | 0.34% | 0.3% | $4.69 |
| 05/19/2017 | 06/14/2017 | $0.004 | 0.39% | 0.37% | $3.79 |
| 02/22/2017 | 03/17/2017 | $0.004 | 0.46% | 0.53% | $2.65 |
| 11/23/2016 | 12/19/2016 | $0.004 | 0.52% | 0.55% | $2.54 |
| 08/23/2016 | 09/16/2016 | $0.003 | 0.73% | 0.73% | $1.57 |
| 05/24/2016 | 06/20/2016 | $0.003 | 0.98% | 0.97% | $1.19 |
| 02/29/2016 | 03/23/2016 | $0.003 | 1.37% | 1.34% | $0.86 |
| 11/18/2015 | 12/14/2015 | $0.003 | 1.27% | 1.42% | $0.81 |
| 08/18/2015 | 09/11/2015 | $0.002 | 1.58% | 1.72% | $0.57 |
| 05/19/2015 | 06/12/2015 | $0.002 | 1.67% | 1.85% | $0.53 |
| 02/24/2015 | 03/19/2015 | $0.002 | 1.52% | 1.47% | $0.58 |
| 11/19/2014 | 12/15/2014 | $0.002 | 1.7% | 1.73% | $0.49 |
| 08/19/2014 | 09/12/2014 | $0.002 | 1.77% | 1.77% | $0.48 |
| 05/20/2014 | 06/13/2014 | $0.002 | 1.79% | 1.73% | $0.49 |
| 02/25/2014 | 03/20/2014 | $0.002 | 1.7% | 1.85% | $0.46 |
| 11/19/2013 | 12/13/2013 | $0.002 | 1.99% | 2.24% | $0.38 |
| 08/20/2013 | 09/13/2013 | $0.002 | 2.03% | 1.88% | $0.40 |
| 05/21/2013 | 06/14/2013 | $0.002 | 1.52% | 2.08% | $0.36 |
| 02/26/2013 | 03/21/2013 | $0.002 | 1.21% | 2.42% | $0.31 |
| 11/20/2012 | 12/14/2012 | $0.002 | 0.65% | 2.42% | $0.31 |
Projected Future Returns & Dividends for NVDA
Based on past 10-year performance, here are NVDA growth metrics:
Share price CAGR of +71.69%
Dividend CAGR of +13.28%
Using NVDA CAGR metrics, we can estimate that your initial $10000 investment, over the next 10 years, should grow as follows:
| NVDA (DRIP) | NVDA - No DRIP | |
|---|---|---|
| Current Price | $180.25 | $180.25 |
| Start Shares | 55.48 | 55.48 |
| Start Value | $10,000 | $10,000 |
| After 10 years: | ||
| Final Share Count | 55.51 | 55.48 |
| Dividends Payment | $0.03 | $0.03 |
| Annual Dividends | $8 | $8 |
| Yield on cost | 0.08% | 0.08% |
| Share Price | $23,362.89 | $23,362.89 |
| Total Dividends | $41 | $41 |
| Final Value | $1,296,970 | $1,296,179 |
NOTE: Above numbers are our estimate based on NVDA's Dividend and Price CAGR over past 10 years.
These numbers should only be considered as "potential future returns"! DRIP assumes reinvesting dividends; No-DRIP assumes collecting dividends as cash.
We cannot guarantee that your actual returns will meet these estimates.
Get the best Dividend Stock Research Tools:
Get 3 months FREE!
Company Info
NVIDIA Corporation (NVDA) had its IPO on 1999-01-22, and is trader on NASDAQ stock exchange.
NVIDIA Corporation provides graphics, and compute and networking solutions in the United States, Taiwan, China, and internationally. The company's Graphics segment offers GeForce GPUs for gaming and PCs, the GeForce NOW game streaming service and related infrastructure, and solutions for gaming platforms; Quadro/NVIDIA RTX GPUs for enterprise workstation graphics; vGPU software for cloud-based visual and virtual computing; automotive platforms for infotainment systems; and Omniverse software for building 3D designs and virtual worlds. Its Compute & Networking segment provides Data Center platforms and systems for AI, HPC, and accelerated computing; Mellanox networking and interconnect solutions; automotive AI Cockpit, autonomous driving development agreements, and autonomous vehicle solutions; cryptocurrency mining processors; Jetson for robotics and other embedded platforms; and NVIDIA AI Enterprise and other software. The company's products are used in gaming, professional visualization, datacenter, and automotive markets. NVIDIA Corporation sells its products to original equipment manufacturers, original device manufacturers, system builders, add-in board manufacturers, retailers/distributors, independent software vendors, Internet and cloud service providers, automotive manufacturers and tier-1 automotive suppliers, mapping companies, start-ups, and other ecosystem participants. It has a strategic collaboration with Kroger Co. NVIDIA Corporation was incorporated in 1993 and is headquartered in Santa Clara, California.
NVDA website: https://www.nvidia.com
Get Full Access to All Reports with DRIPCalc PRO
Get 3 months FREE!

